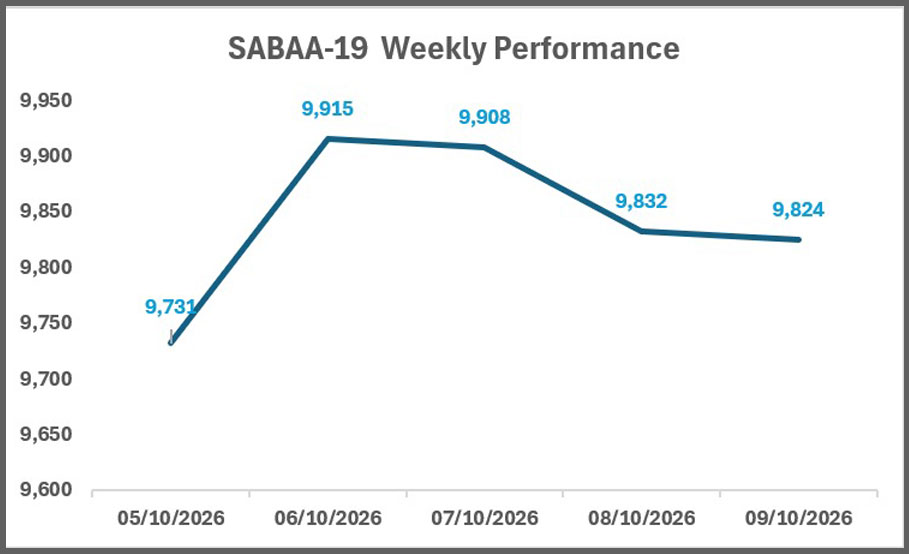
SABAA-19 INDEX WEEKLY PERFORMANCE [ 5th to 9th OCOTBER, 2026 ]
| STOCKS |
OPEN [Rs.] |
HIGH [Rs.] |
LOW [Rs.] |
CLOSE [Rs.] |
AVG. VOLUME/DAY [SHARES] |
PRICE RANGE [Rs.] |
PRICE CHANGE [Rs.] |
CHANGE [%] |
| AKBL |
104.20 |
108.00 |
102.16 |
105.24 |
1,147,069 |
5.84 |
1.04 |
1.00 |
| BOP |
29.90 |
30.23 |
28.55 |
29.08 |
232,374 |
1.68 |
-0.82 |
-2.74 |
| CSAP |
90.00 |
91.51 |
88.04 |
89.55 |
4141.712 |
3.47 |
-0.45 |
-0.50 |
| DGKC |
185.01 |
190.39 |
182.5 |
184.38 |
86860.104 |
7.89 |
-0.63 |
-0.34 |
| ENGROH |
262 |
267 |
255.3 |
263.5 |
42220.08 |
11.7 |
1.5 |
0.57 |
| FFC |
537.9 |
543 |
532.5 |
534.86 |
15614.76 |
10.5 |
-3.04 |
-0.57 |
| GAL |
516 |
519.8 |
490 |
494.36 |
18993.08 |
29.8 |
-21.64 |
-4.19 |
| GLAXO |
312.2 |
317.98 |
305 |
316.6 |
3451.056 |
12.98 |
4.40 |
1.41 |
| GCIL |
30.86 |
32 |
30.09 |
30.93 |
56826.24 |
1.91 |
0.07 |
0.23 |
| HCAR |
211.64 |
211.64 |
202 |
206.6 |
4677.736 |
9.64 |
-5.04 |
-2.38 |
| HUBC |
198.75 |
203.88 |
195.01 |
200.15 |
70306.704 |
8.87 |
1.4 |
0.70 |
| ILP |
96.92 |
97 |
93.49 |
94.73 |
6789.92 |
3.51 |
-2.19 |
-2.26 |
| LUCK |
409.73 |
413.49 |
404.58 |
405.38 |
32174.56 |
8.91 |
-4.35 |
-1.06 |
| MUGHAL |
68.7 |
69.87 |
63 |
67.74 |
9508.216 |
6.87 |
-0.96 |
-1.40 |
| NRL |
594.09 |
653.9 |
590.5 |
642.61 |
80050.408 |
63.4 |
48.52 |
8.17 |
| OGDC |
313.89 |
318.45 |
305.48 |
306.12 |
69709.576 |
12.97 |
-7.77 |
-2.48 |
| PRL |
89.93 |
97.99 |
85.85 |
93.07 |
993678.016 |
12.14 |
3.14 |
3.49 |
| PSO |
345.01 |
366.4 |
340.23 |
360.66 |
106288.664 |
26.17 |
15.65 |
4.54 |
| PPL |
220 |
223.7 |
213.76 |
218.94 |
125543.608 |
9.94 |
-1.06 |
-0.48 |
SABAA-19 INDEX WEEKLY PERFORMANCE CHART [ 5th to 9th OCOTBER, 2026 ]
SABAA-19 INDEX INTRODUCTION
The SABAA-19 Index formed on September 19, 2026, to serve as a transparent benchmark aligned with global best practices. The index is calculated using the Free Float Market Capitalization Methodology, the global standard adopted by MSCI, FTSE, S&P, STOXX, and SENSEX.
SABAA-19 Index consists of 19 companies listed on Pakistan Stock Exchange, having consistent growth and stable financial outlook. The primary objective is to track index performance, enabling investors to construct well balanced portfolios and to evaluate both their portfolio returns and comparative index performance.