

| PIVOT ANAYLSIS | INDEX LEVEL |
|---|---|
| RESISTANCE 3 | 173,118 |
| RESISTANCE 2 | 172,078 |
| RESISTANCE 1 | 171,481 |
| PIVOT POINT | 170,441 |
| SUPPORT 1 | 169,844 |
| SUPPORT 2 | 168,804 |
| SUPPORT 3 | 168,207 |
| PROJECTED HIGH & LOW | HIGH | LOW | RANGE |
|---|---|---|---|
| CLASSIC | 171,481 | 169,844 | 1,637 |
| FIBONACCI | 171,897 | 169,873 | 2,023 |
| VOLATILITY - ADJUSTED | 171,389 | 170,381 | 1,008 |
| MODERATE TRADING BAND | 171,704 | 170,067 | 1,637 |
| BREAKOUT HIGH & LOW | 171,897 | 169,844 | 2,052 |
| MOMENTUM INDICATORS | VALUE | SIGNAL |
|---|---|---|
| 7 DAYS EMA | 170,054 | BUY |
| 9 DAYS EMA | 170,453 | SELL |
| 14 DAYS EMA | 171,521 | SELL |
| 30 DAYS EMA | 173,748 | SELL |
| 50 DAYS SMA | 175,977 | SELL |
| 100 DAYS SMA | 174,383 | SELL |
| 200 DAYS SMA | 172,260 | SELL |
| ATR(14) | 504.16 | LOW VOLATILITY |
| VOLATILITY(%) | 0.30 | LOW |
| ADX_RSI | NEUTRAL | |
| ADX(14) | 33.00 | MODERATE |
| RSI(14) | 43.36 | NEUTRAL |
| STOCH(14) | 26.71 | NEUTRAL |
| MID-BAND | 173,396 | DOWNTREND |
| CANDLESTICK | Marubozu | BULLISH |
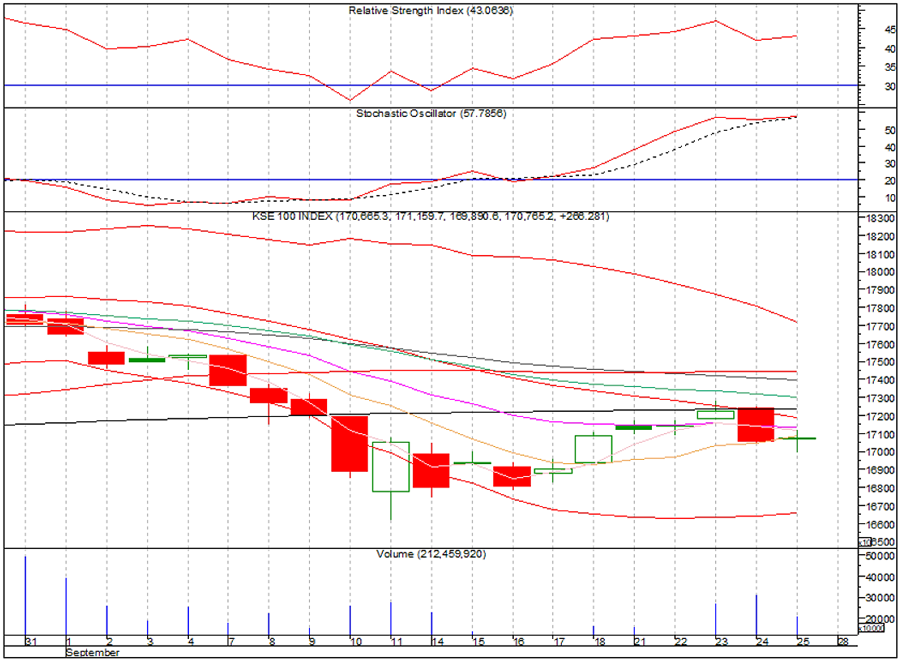
KSE-100 Index managed to maintain 170,800 level. Although volume was low but better than the previous three days as fresh buying was seen at low price levels. Momentum indicators have entered the neutral zone, giving neutral to positive stance. Index would have a series of resistances from 171,500 to 176,000 levels, provided by multiple moving averages. On the other side, Index is likely to get a strong support area from 169,250 to 166,500 points levels. Market trend will not be turned bullish till it cross 176,000 level. Stay Alert at major resistance levels